Plotting KKR DOS/bandstructures
This section discusses how the standard output files for density of states and bandstructure calculations of a KKR calculation can be visualized.
Density of states
#Example: KKR DOS

from masci_tools.vis.kkr_plot_dos import dosplot

# the path can be a relative or absolute path to the directory
# where the dos.atom files reside (i.e. the dir where the DOS calculation ran)
dosplot('files/kkr_dos/', color='k', lw=4, marker='v', ls=':', ms=8)
files/kkr_dos/dos.atom1
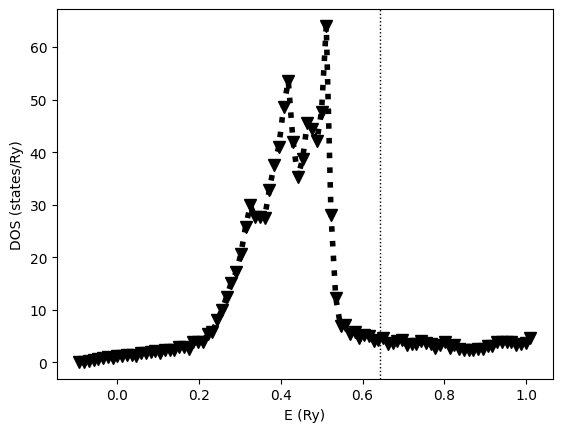
DOS of bulk fcc Cu.
Where the color, lw, etc inputs are optional settings which customize the plot:
We can also use this to show the l-decomposed DOS (red line are d-orbitals):
#Example: KKR DOS, l-resolved

dosplot('files/kkr_dos/', totonly=False)
files/kkr_dos/dos.atom1
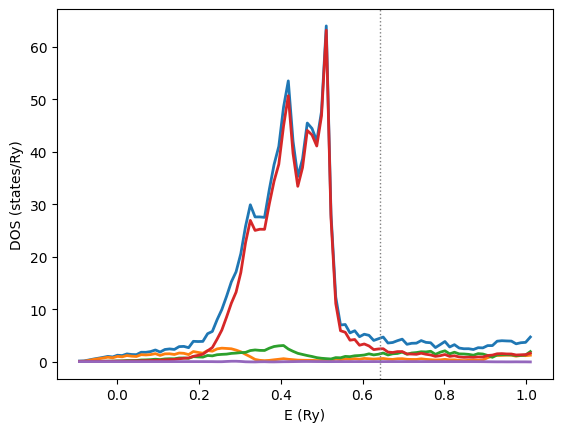
DOS of bulk fcc Cu, l-resolved.
Bandstructure
#Example: KKR bandstructure

from masci_tools.vis.kkr_plot_bandstruc_qdos import dispersionplot

# the path can be a relative or absolute path to the directory
# where the qdos files reside (i.e. the dir where the qdos calculation ran)
dispersionplot('files/kkr_bandstruc/', ptitle='bulk Cu')
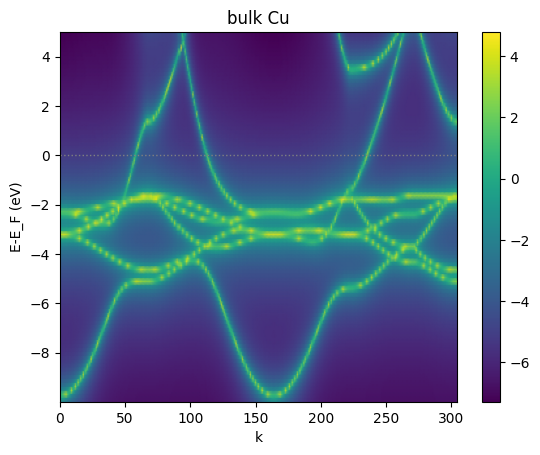
Bandstructure of bulk fcc Cu.
Which can also be customized with keyword arguments to the dispersionplot function:
#Example: KKR bandstructure with custom color map

dispersionplot('files/kkr_bandstruc/', ptitle='bulk Cu', cmap='binary', clims=[-2,2], clrbar=False)
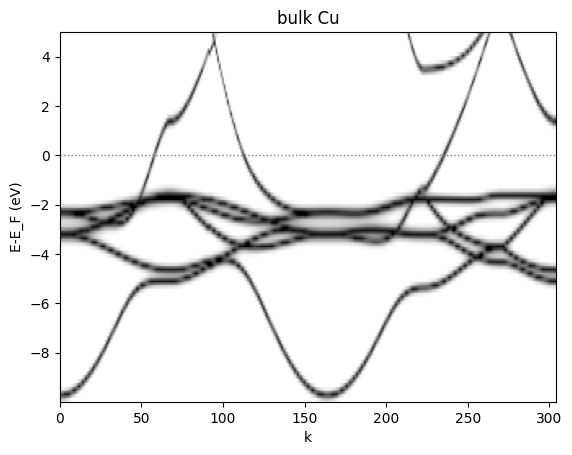
Bandstructure of bulk fcc Cu.
Fermi surface
Constant energy contours can be calculated by using a single energy point in a qdos calculation with a 2D k-point grid defined in the qvec.dat input file to KKRhost.
For example, this can then be used to visualize a cut through the Fermi surface of a material.
#Example: KKR bandstructure

from masci_tools.vis.kkr_plot_FS_qdos import FSqdos2D

# the path can be a relative or absolute path to the directory
# where the qdos files reside (i.e. the dir where the qdos calculation ran)
FSqdos2D('PATH/TO/OUTPUT-FILES/')